Monitoring in Prometheus and grafana docker dashboard, Cadvisor.

Pushing code to its limits, one test at a time - I'm a QA engineer with a passion for coding and testing
In this article, we will run a docker container and we will monitor and see the cpu utilization and other metrics in prometheus and grafana dashboard.
what is cadvisor -cAdvisor (Container Advisor) is an open-source tool developed by Google that provides container-level performance metrics. It is specifically designed to work with containerized environments, such as Docker. cAdvisor is used to collect, aggregate, and export information about running containers. This information includes resource usage metrics, performance statistics, and other relevant data.
In the context of Prometheus, cAdvisor serves as an exporter. An exporter in the Prometheus ecosystem is a component that collects metrics from a third-party system and makes them available for Prometheus to scrape. In this case, cAdvisor collects container metrics and exposes them in a format that Prometheus can understand. Prometheus then scrapes these metrics from the cAdvisor service at regular intervals.
The Architecture of Prometheus Monitoring:
Prometheus follows a simple and scalable architecture. It consists of the following components:
Prometheus Server: The core component responsible for data collection, storage, and retrieval. It regularly scrapes metrics from target endpoints using HTTP or specialized exporters.
Exporters: These are agent-like processes that expose metrics of specific services or systems in a format that Prometheus understands. Exporters enable Prometheus to collect metrics from various technologies such as databases, web servers, or message queues.
Data Storage: Prometheus employs a time-series database to store collected metrics. The data is stored locally on disk, allowing for high performance and reliability.
Alertmanager: Responsible for handling and sending alerts based on predefined rules and conditions. It integrates with Prometheus and enables users to define alerting rules and configure various notification channels.
Client Libraries: Prometheus offers client libraries in different programming languages. These libraries assist in instrumenting applications to expose custom metrics and integrate with the Prometheus server.
steps--
make a ec2 instance of t2.medium
Install docker and docker compose on ec2 instance
make a directory prometheus.
install prometheus via document -wget command (check readme file https://github.com/krishkprawat/grafana-prometheus-cadvisor-Tutorial/blob/main/README.md)
make a compose file -- see the compose file in this repo- https://github.com/krishkprawat/grafana-prometheus-cadvisor-Tutorial/blob/main/README.md
this Docker Compose file helps you set up a monitoring environment using Prometheus and cAdvisor to collect and visualize container metrics. Redis is an in-memory data structure store often used as a database, cache, and message broker.
This file is used to define and run multi-container Docker applications. In your case, it specifies three services: prometheus, cadvisor, and redis. Let me break down the configuration:
version: '3.2'
services:
  prometheus:
    image: prom/prometheus:latest
    container_name: prometheus
    ports:
    - 9090:9090
    command:
    - --config.file=/etc/prometheus/prometheus.yml
    volumes:
    - ./prometheus.yml:/etc/prometheus/prometheus.yml:ro
    depends_on:
    - cadvisor

  cadvisor:
    image: gcr.io/cadvisor/cadvisor:latest
    container_name: cadvisor
    ports:
    - 8080:8080
    volumes:
    - /:/rootfs:ro
    - /var/run:/var/run:rw
    - /sys:/sys:ro
    - /var/lib/docker/:/var/lib/docker:ro
    depends_on:
    - redis

  redis:
    image: redis:latest
    container_name: redis
    ports:
    - 6379:6379
Here's a breakdown of the key components:
Services:
prometheus: Runs the Prometheus monitoring tool. It exposes its web interface on port 9090 and depends on thecadvisorservice. It uses a volume to mount theprometheus.ymlconfiguration file.cadvisor: Runs Google's cAdvisor, collecting container resource usage. It exposes its web interface on port 8080 and depends on theredisservice.redis: Runs the Redis database server, exposing its default port 6379.
Images:
prom/prometheus:latest: The latest version of the Prometheus image.gcr.io/cadvisor/cadvisor:latest: The latest version of the cAdvisor image.redis:latest: The latest version of the Redis image.
Container Names:
- Each service has a specified container name (
prometheus,cadvisor,redis).
- Each service has a specified container name (
Ports:
- Port mappings are defined for each service (
9090:9090for Prometheus,8080:8080for cAdvisor,6379:6379for Redis).
- Port mappings are defined for each service (
Volume Mounts:
- Prometheus uses a volume to mount the
prometheus.ymlconfiguration file.
- Prometheus uses a volume to mount the
Dependencies:
prometheusdepends oncadvisor.cadvisordepends onredis.
Now, move on to other stpes-
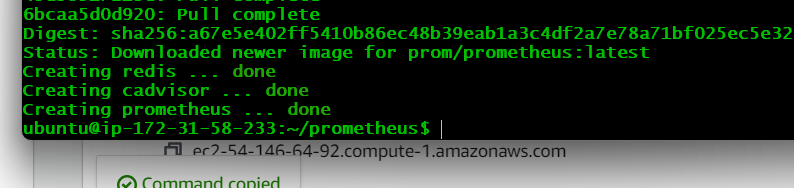
run docker-compose up -d - this will create 3 containers - cadvisor, prometheus and redis.
open the port - 8080 (cadvisor), 9090 (prometheus gui) in ec2 instance
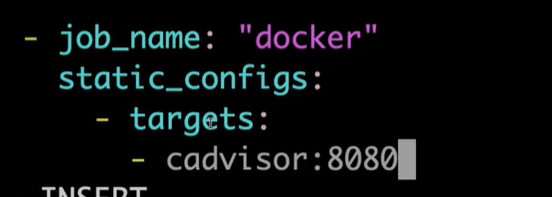
go to prometheus > status> target- there is no target at all right now , to add the target <> here, add the new job in prometheus.yml scrape_configs:
job_name: docker
docker static_configs:
targets:
<container_name>: port
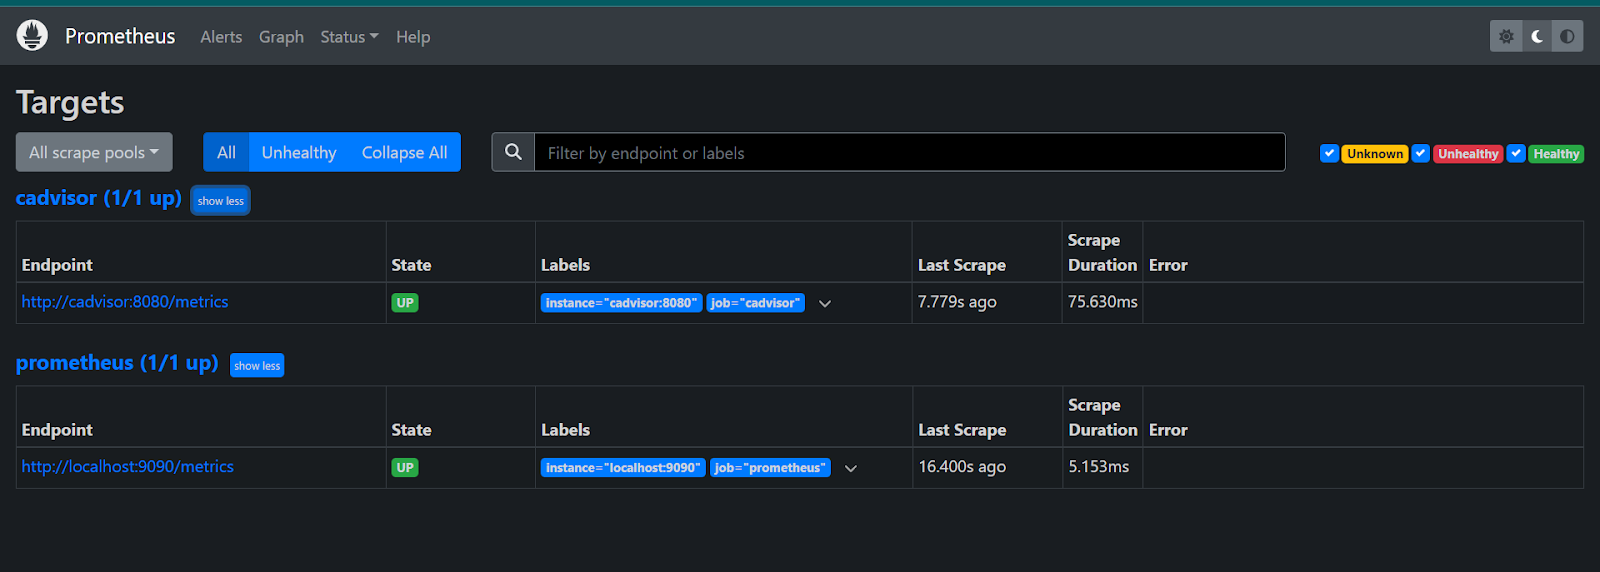
restart the docker container and see the prometheus gui now, automatically a target <> will be added there.
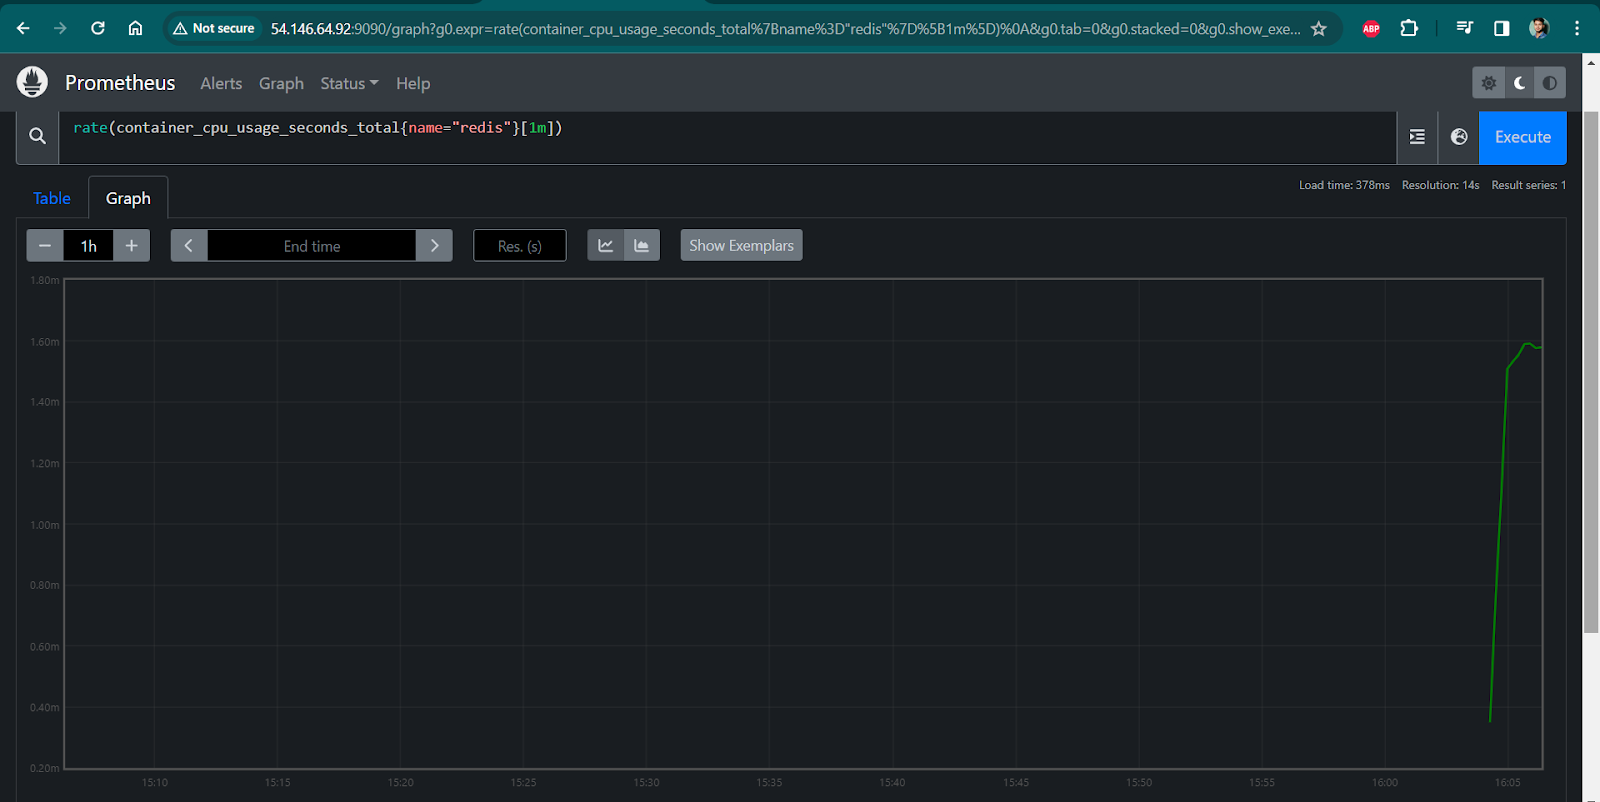
goto graph and hit the promQL - rate(container_cpu_usage_seconds_total{name="redis"}[1m])
see the metrics of other docker container
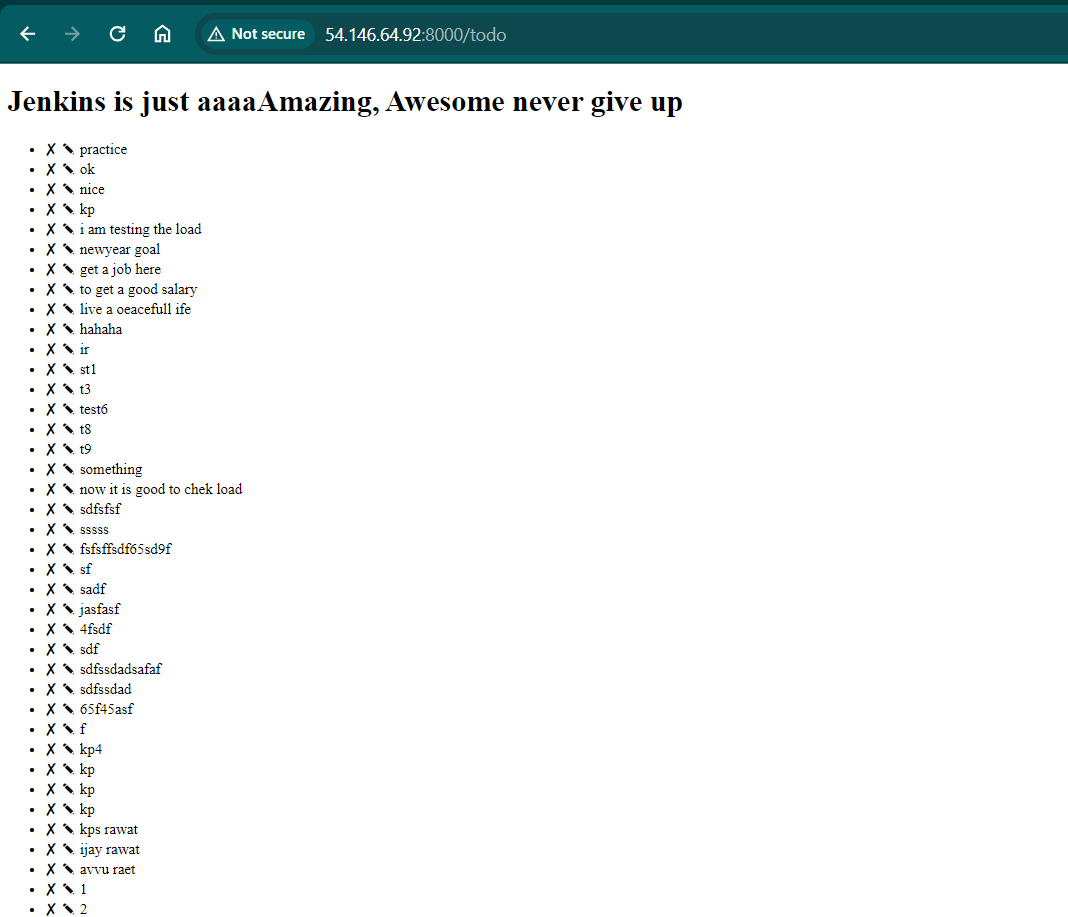
run the docker container directly in terminal
docker run -d -p 8000:8000 --name todo-app krishpauri/node-todo-cicd:latest
docker ps - docker container should run now.
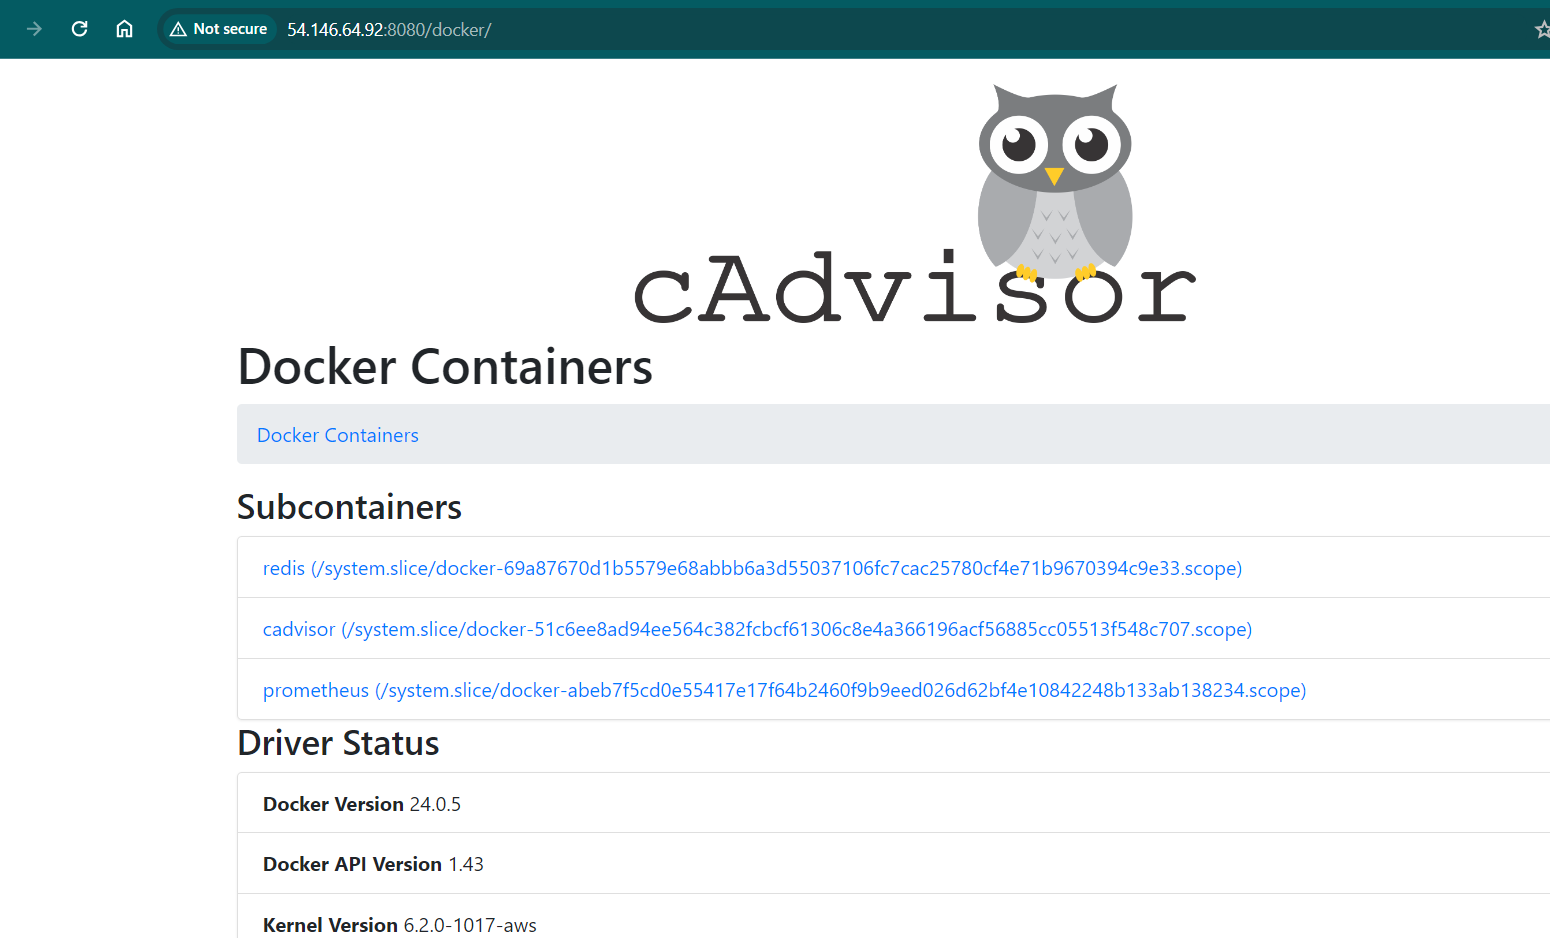
go to cadvisor gui and this new todo-app should show there also.
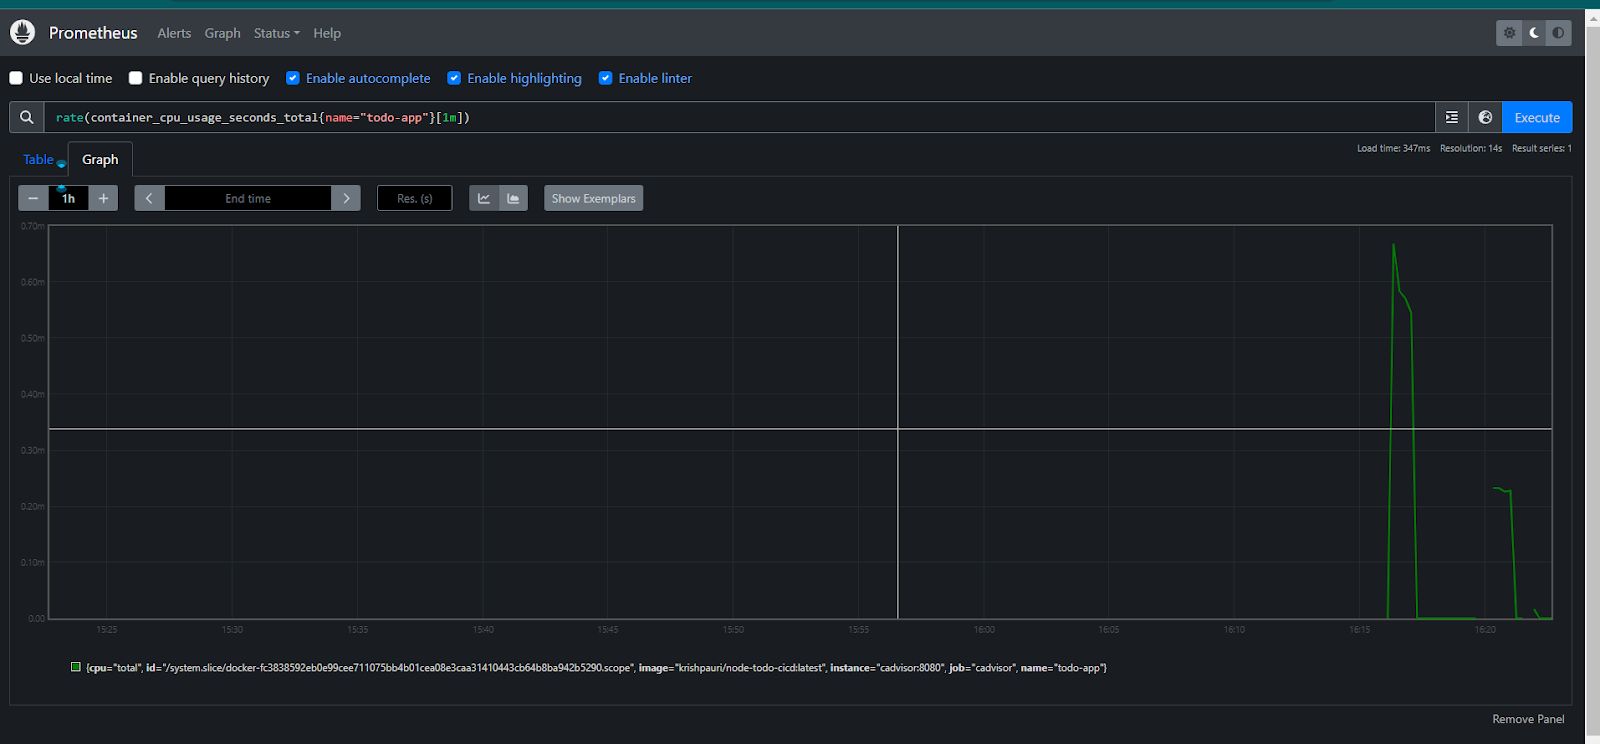
goto prometheus, and hit the promQL - rate(container_cpu_usage_seconds_total{name="todo-app"}[1m]) 6
see the dashboard in grafana
install grafana via doc. - see readme file.
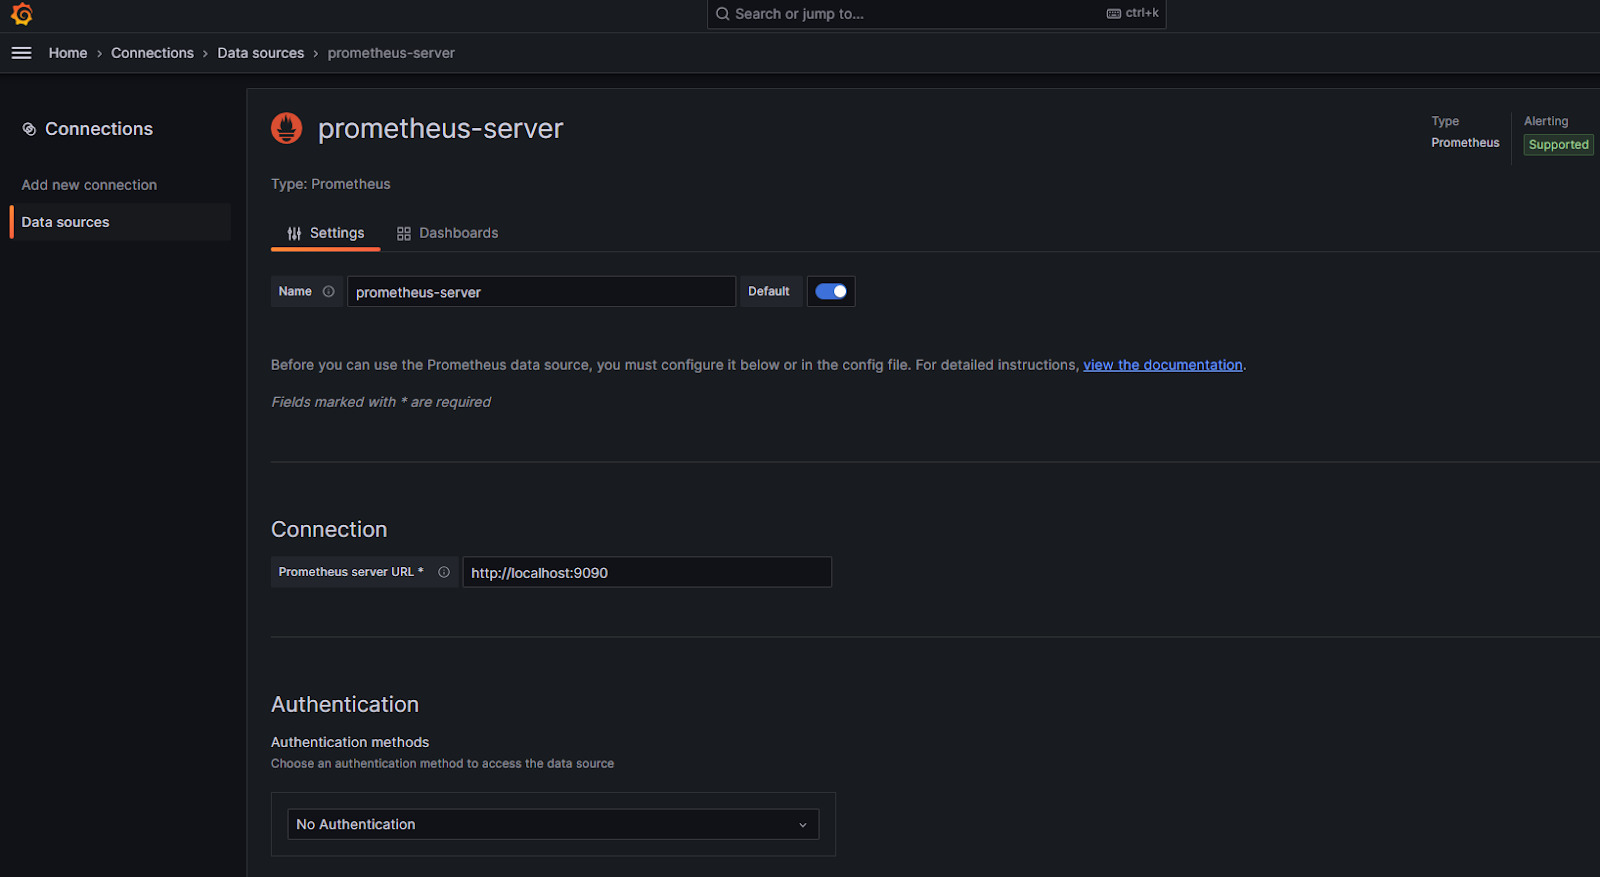
open grafana - add data source => add prometheus => add name and server url (localhost:9090)
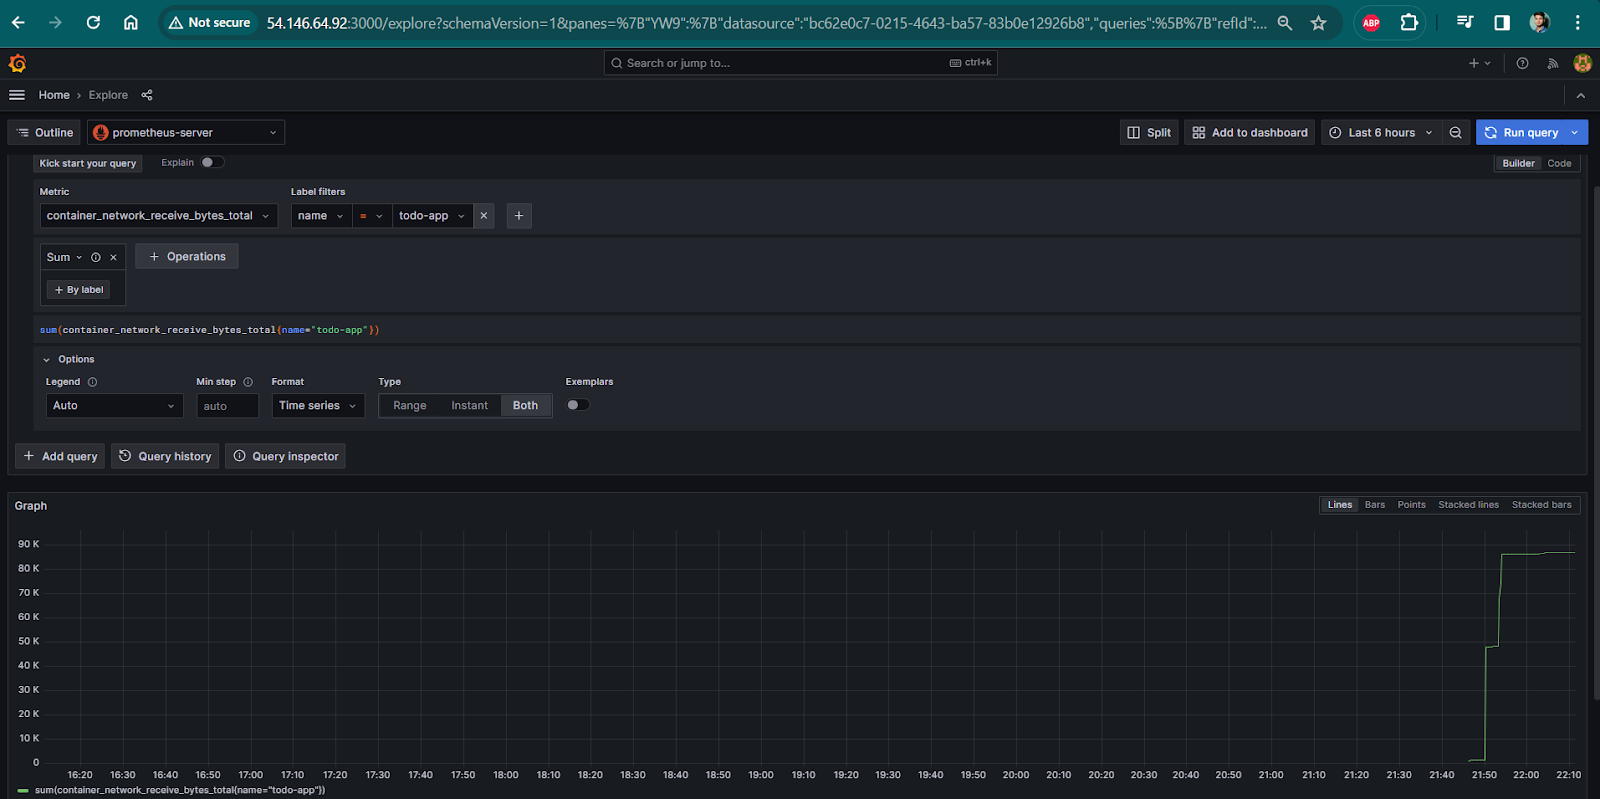
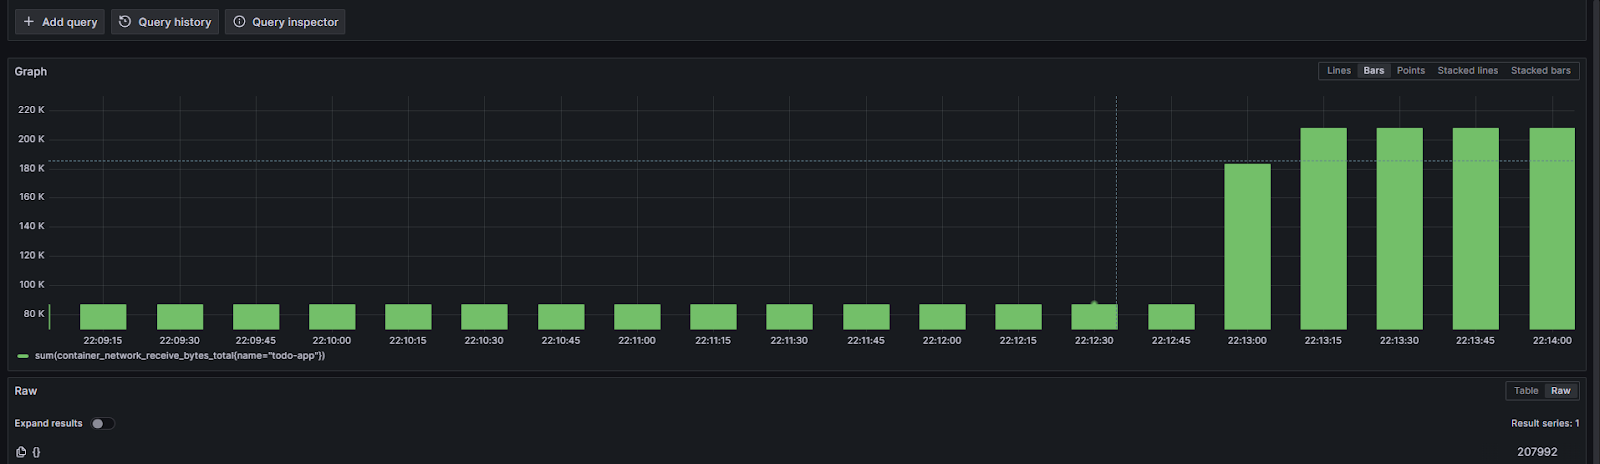
explore view > enter queries-> metric- container network recive bytes
label - name
selecyty value - select your container name
operation - aggregate -sum/count and EXECUTE.
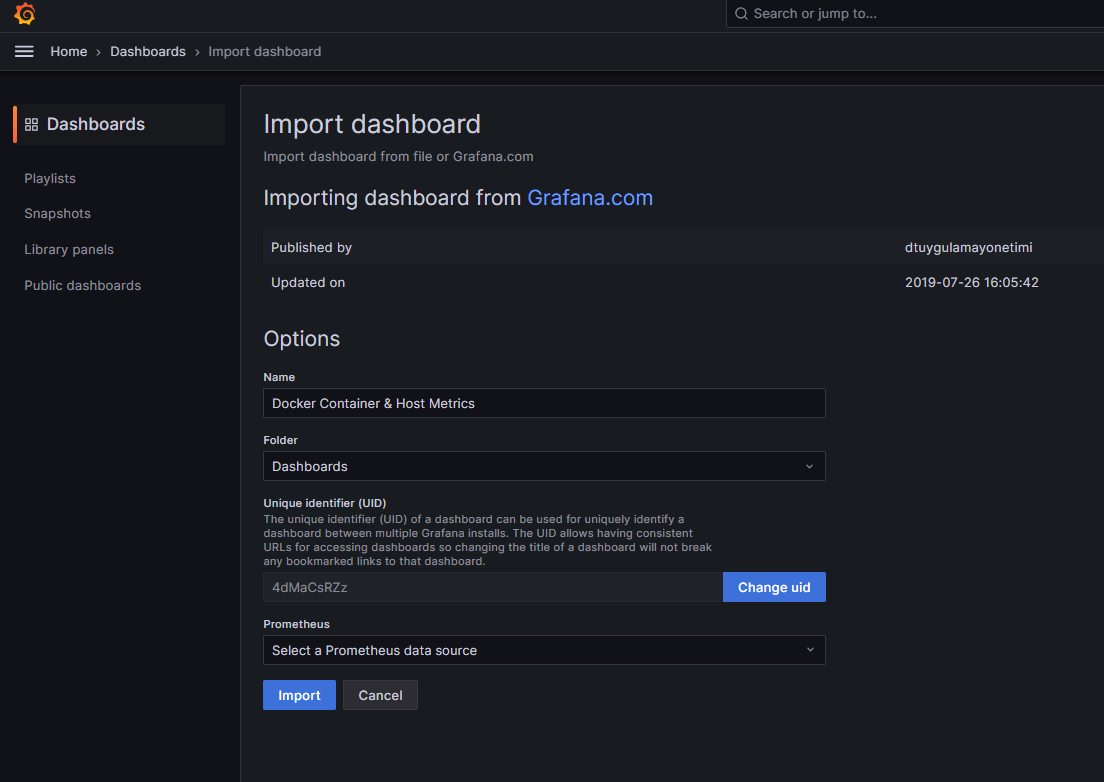
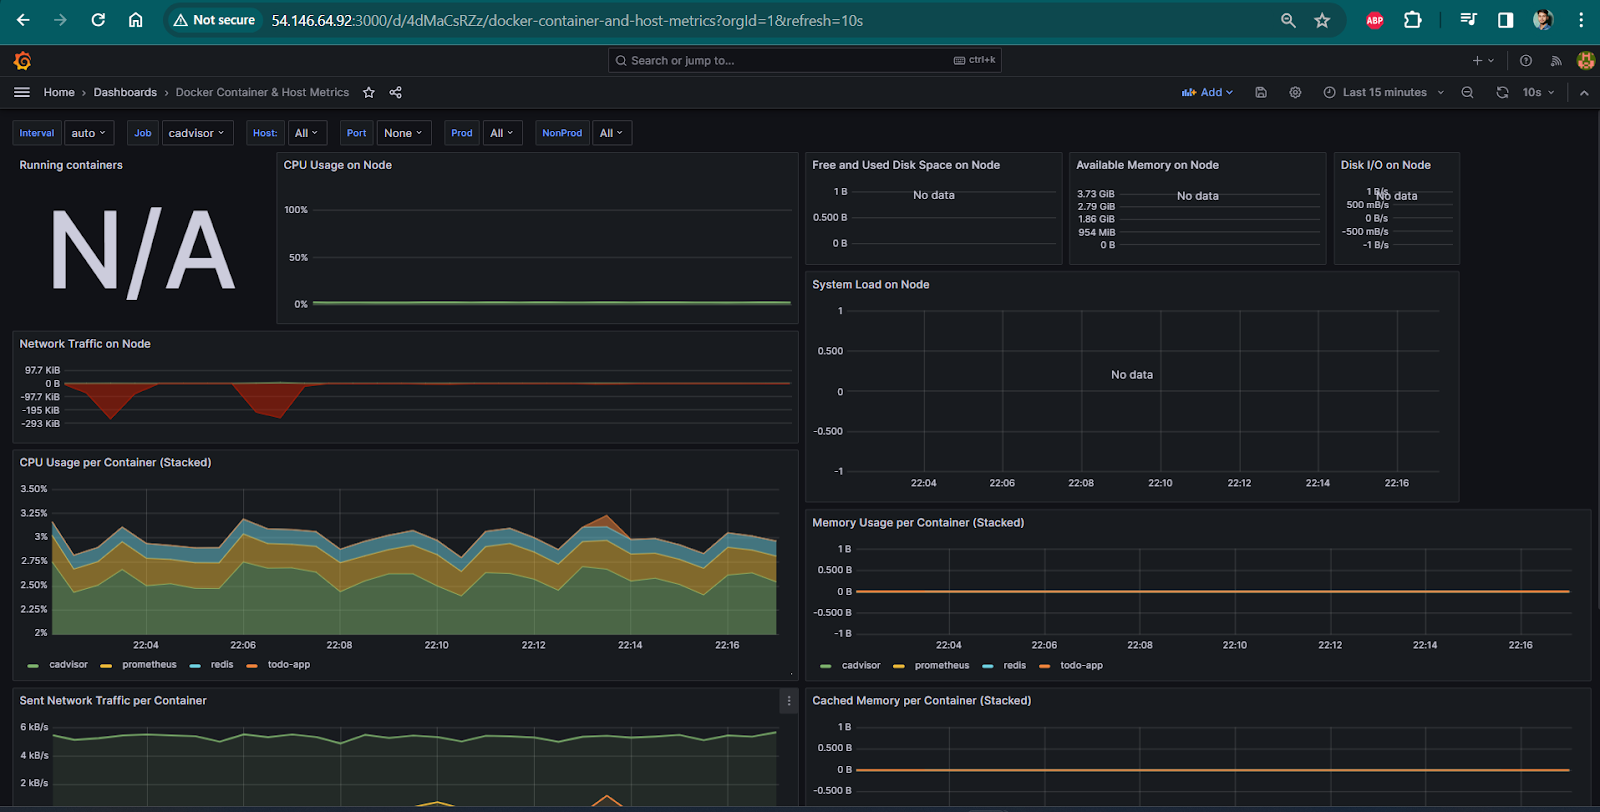
to see the docker dashboard - goto prometheus dashboard - search docker - copy the ID.
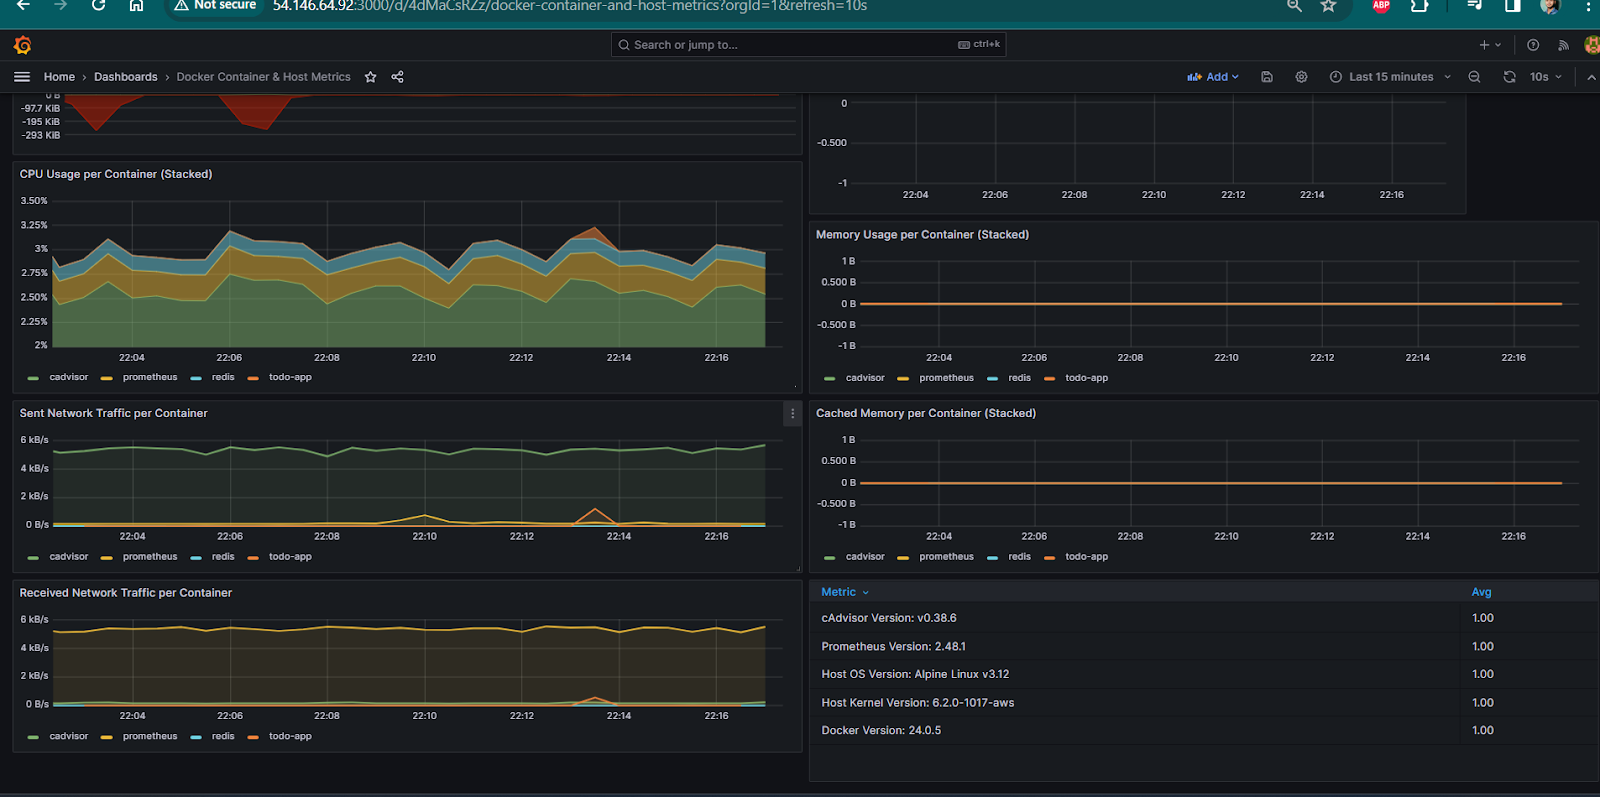
got to prometheus- dashbaord - add new - paste the ID and select the prometheus server and hit enter. thts all now you will see the docker metrics in dashboard.
Thanks for reading. happy learning:)